Read more about our corporate brand here.

Search
US Treasuries

Treasury market infrastructure: How it shapes corporate cash investing

Jose Sevilla, Jason Graveley
October 28, 2026

Key takeaways

  • The Treasury market is not simply a place to park money and collect yield—it's the foundation for global financial liquidity, collateral and risk management.
  • Although we all tend to focus on headline yields, understanding the Treasury market infrastructure can explain changes in financing conditions and borrowing costs.
  • The Fed controls short-term rates, but the market determines longer-term yields. These yields shape broader financial conditions, and thus they remain vital to shorter-duration corporate cash portfolios.

Economic vista: Treasury market plumbing: Why investors should look beyond yields

Jose Sevilla, Principal Portfolio Management Advisor

When investors think about the US Treasury market, they tend to focus on yields, interest rates and Federal Reserve policy when evaluating cash investments. Is the 10-year Treasury breaking above 5%? Is the yield curve steepening or flattening? What is the Fed likely to do next? We don't blame them. Those are vital questions that have far-reaching implications across the entire financial system and broader economy.

Yet the US Treasury market is more than a benchmark for corporate cash investing and liquidity management. Behind every Treasury security is a complex network that helps keep liquidity flowing throughout the financial system. Investors, dealers, banks, financing markets, clearing systems and Treasury operations all work in unison to keep the market functioning smoothly. It is the bond market's equivalent of plumbing—rarely noticed when everything works, but under scrutiny when something goes wrong. Given its importance to financial markets and corporate liquidity, it's worth examining the infrastructure that supports the US Treasury market.

The Treasury market is under pressure but operating smoothly

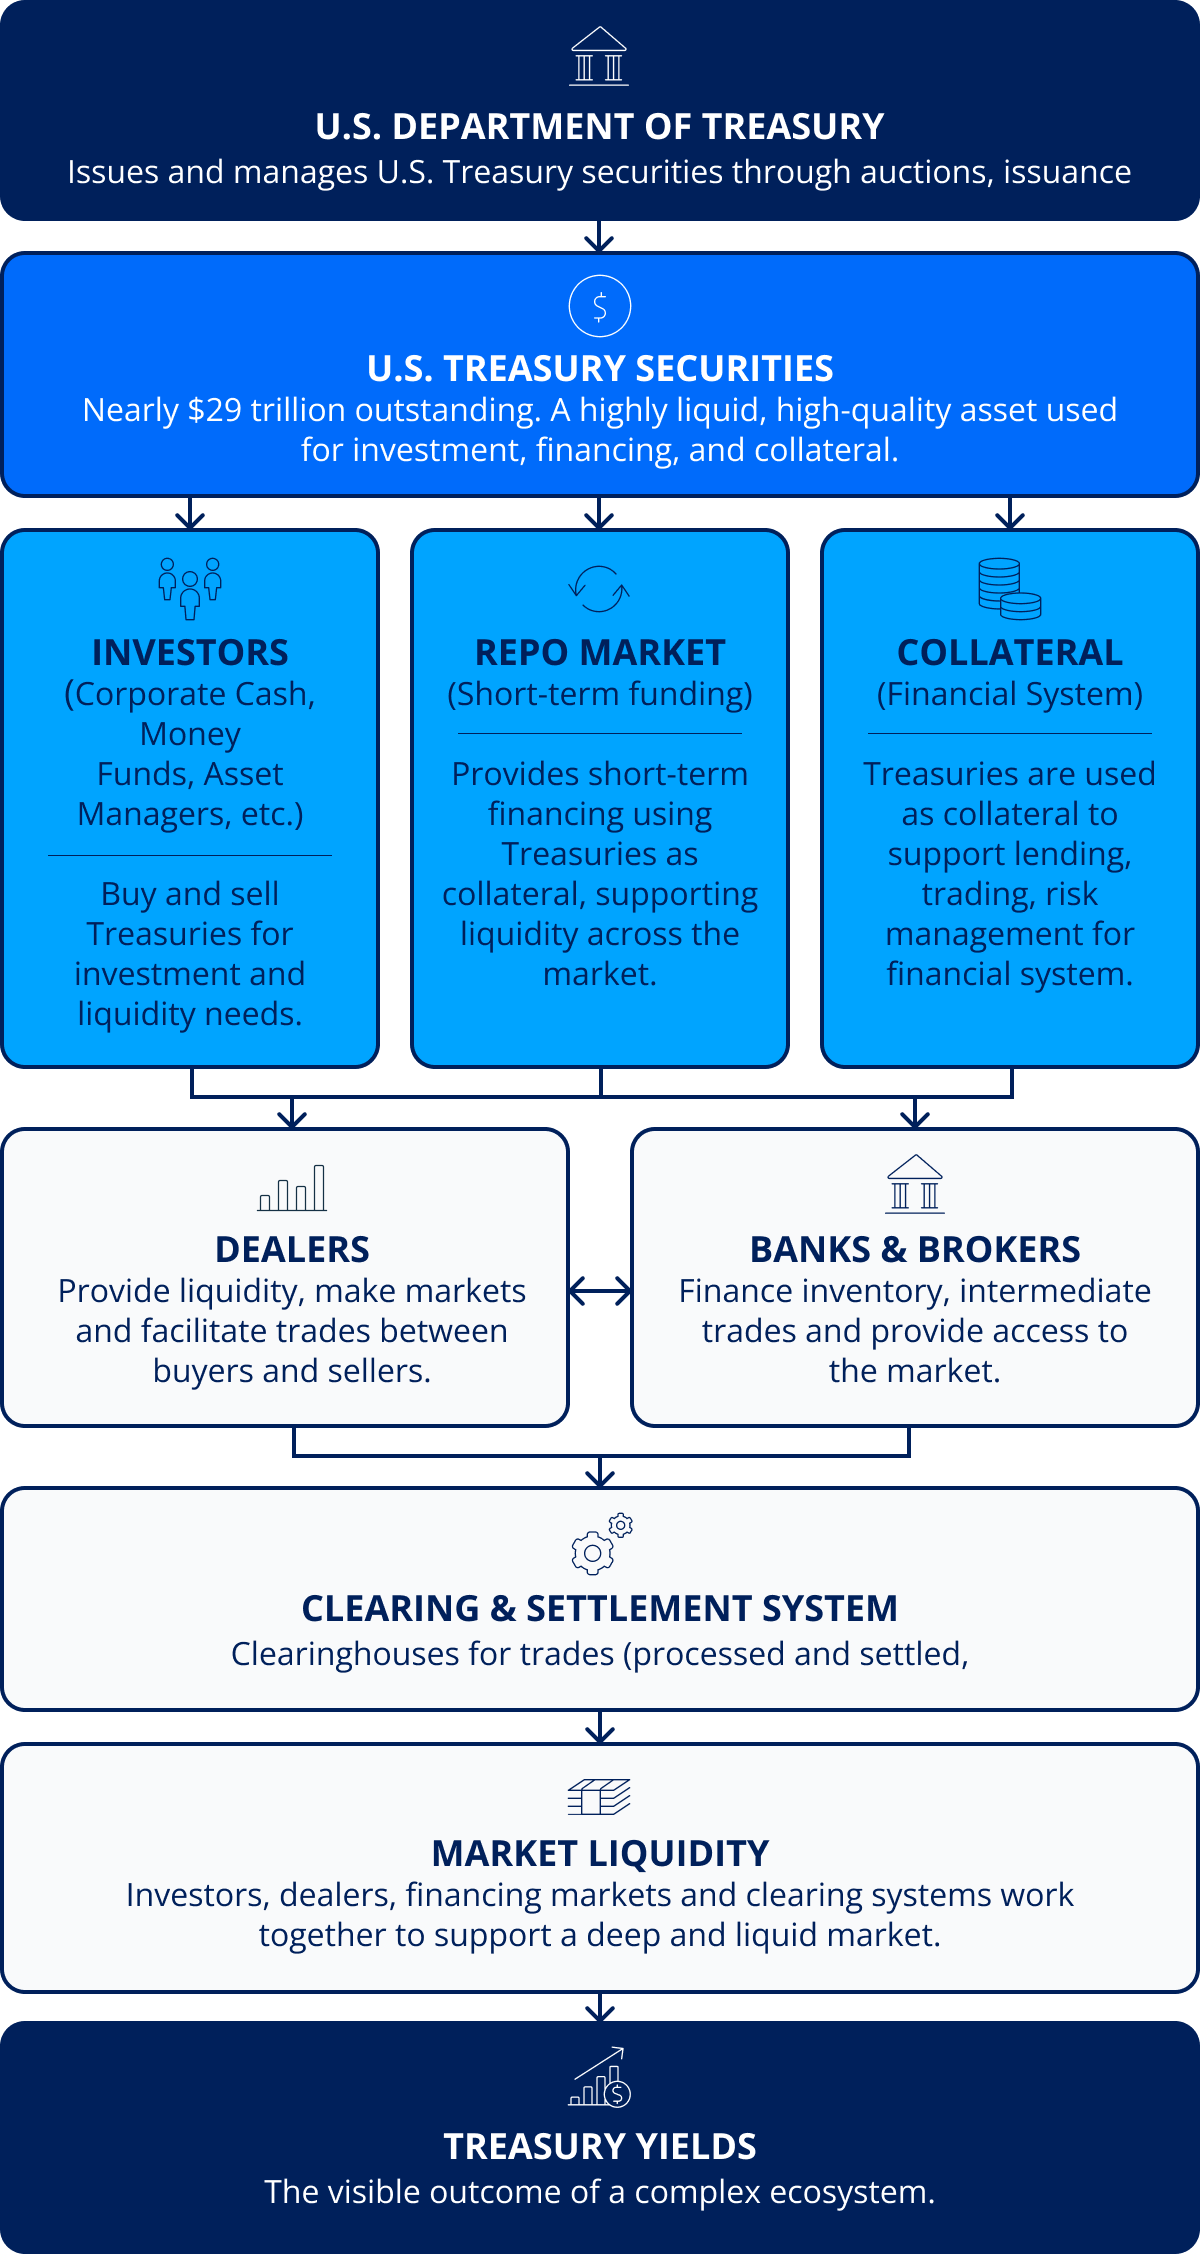
The Treasury market has been under pressure for much of the year as investors grapple with an array of opposing influences, including persistent inflation, resilient economic growth, heavy government borrowing, elevated federal debt levels, geopolitical turmoil and uncertainty surrounding the path of monetary policy. Long-term yields have risen sharply this year, with the 10-year Treasury yield reaching a year-to-date high of 5.34% on October 1 and the 30-year Treasury yield climbing to levels not seen in more than two decades.D That matters because Treasury yields are more than just market statistics. They serve as the benchmark that helps determine borrowing costs, asset valuations and the cost of capital across the financial system. The diagram below illustrates the inner workings of the Treasury market.

The infrastructure behind treasury market liquidity

A network of participants and systems work together to keep the Treasury market functioning.

Flow chart graphic depicting network of participants in the US Treasury market including the securities themselves, investors, dealers, the repo market, collateral, banks and brokers, clearing and settlement, and market liquidity resulting ultimately in treasury yields. Source: US Department of Treasury (https://home.treasury.gov), Federal Reserve Bank of New York (https://www.newyorkfed.org/tmpg), SIFMA (https://www.sifma.org).

At the center of this entire system are the Treasury securities themselves. Investors ranging from corporate cash managers and money market funds to pension plans, insurers, asset managers and foreign institutions often hold Treasuries for their liquidity, capital preservation and creditworthiness. After all, the 10-year US Treasury yield is often used as a proxy for the risk-free rate and is widely viewed as carrying negligible credit risk when held to maturity. Those same securities serve as the foundation for financing, collateral and risk management across the broader financial system.

That is where dealers become particularly important. When an investor wants to buy or sell a Treasury security, a dealer often stands between the two parties, helping facilitate the transaction and providing liquidity. Dealers, however, do not operate in isolation. They depend heavily on an underlying network of banks, brokers and financing markets to support their inventories and trading activity.

Also vital to this infrastructure are repurchase agreements, or the repo market. Repo is essentially short-term secured borrowing in which Treasury securities are pledged as collateral in exchange for cash. While it may sound like a technical corner of the market, repos are essential to keeping the pipes clean and securities moving efficiently throughout the market system. It also helps fund positions and support liquidity. The ability to finance Treasuries reliably through the repo market is one of the reasons the market remains so deep and liquid.

Treasury issuance creates feedback loops yields don't show

The liquidity and seamless function of the Treasury market become especially significant when the government is issuing such large amounts of debt. With persistent annual budget deficits and a total accumulated debt that has surpassed $40 trillion, the United States has a substantial and growing financing requirement. Higher yields mean refinancing maturing debt becomes increasingly expensive over time. The effect is gradual because the government does not re-finance its entire debt at current rates. However, as older, lower-yielding securities mature and are replaced with new issuance, financing costs move closer to prevailing market levels.

This creates an uncomfortable feedback loop. Larger borrowing needs can require more Treasury issuance, while investors may demand greater compensation to absorb that supply, particularly at the long end of the curve. Higher yields then increase the government's future interest burden. Recent estimates place annual federal interest expense at roughly $1 trillion, with projections pointing higher if current yields persist.D

Recent actions by Treasury Secretary Scott Bessent provide an example of how policymakers can attempt to support market efficiency. Back in August, the Department of Treasury announced plans to increase buybacks for longer-dated Treasury securities. They characterized the program as a way to support liquidity and improve operational stability in areas where selling pressure had become concentrated. The important point is that the Department of Treasury is not simply issuing debt, but it's also actively managing the market structure that supports its debt. Yet the market's response illustrates how difficult it can be to influence long-term borrowing costs. Larger forces, such as inflation expectations, economic growth, issuance levels and investor demand, continue to drive market outcomes. Despite the buyback announcement, long-term yields have continued to rise as we entered the fourth quarter of 2026.

The upshot for corporate cash investors

The Treasury market is not simply a place to park money and collect yield. Rather, it serves as a foundation for much of the global financial system. Treasuries serve as collateral and are financed through repo markets. They are traded by dealers and supported by an array of banks and brokers and are processed through treasury clearing and settlement systems that manage counterparty risk and ensure transactions are completed efficiently. When this infrastructure is functioning as intended, capital moves freely and transactions occur with little friction, making the system's importance easy to overlook. When liquidity becomes strained, funding conditions can tighten, trading can become less efficient and disruptions in the Treasury market can spread to other parts of the financial system. The underlying infrastructure is of paramount importance.

When we think about the inner workings of the Treasury market in the context of the current macro environment, we're also reminded of another important distinction: The Fed may control short-term monetary policy, but it doesn't directly control the long end of the Treasury curve. Collectively, the market ultimately determines what investors require to lend money to the US government for 10, 20 or 30 years. Expectations for inflation, economic growth, Treasury issuance, global demand and the term premium all play a role. For corporate cash investors, these longer-term yields remain important even when portfolios are focused on short-duration instruments because they shape broader financial conditions. Higher Treasury yields can create opportunities to earn more on cash, but they also affect corporate borrowing costs, refinancing decisions, credit spreads and the overall cost of capital.

When it comes to the Treasury market, we realize that most investors are focused on yields. But remember, yields are just the headline. There is a deep and complex plumbing system that supports the entire market, and we think investors should maintain an awareness of the market infrastructure that ultimately influences those headline yields.

Contact SVB Asset Management to discuss how Treasury market conditions may affect your corporate cash investment strategy.

Trading vista: Higher for longer: What rising rate expectations mean for short-duration investors

Jason Graveley, Senior Manager, Fixed Income Trading

Corporate treasury professionals and fixed income investors have spent much of the past 2 years evaluating the path of Federal Reserve policy, Treasury yields and short-duration investment opportunities. Today, the conversation has shifted. Rather than debating how quickly rates may decline, investors are increasingly considering whether interest rates could remain higher for longer and potentially move higher still. While that environment presents challenges for borrowers, it may also create opportunities for cash investors and short-duration portfolios.

For much of the past 2 years, the story in rates appeared fairly straightforward. After beginning to ease in September 2024, the Fed lowered its target range from 4.75%–5.00% to 3.50%–3.75% by December 2025.D The path was not always a straight line, but the general expectation was that policy was gradually moving back toward neutral and that additional tightening was behind us. Surely the Fed would become more accommodative? However, that narrative has shifted materially this year, not coincidentally alongside new military action in the Middle East and an abrupt spike in energy prices.

Persistent inflation, resilient economic growth and a labor market that has been slow to weaken have challenged the idea that the existing level of rates was restrictive enough to control inflation without unnecessarily weakening economic growth. In September, the Fed reversed course and raised its target range by 25 basis points (bps) to 3.75%–4.00%. What had been viewed as a gradual return toward neutral suddenly gave way to the view that tighter policy would once again be necessary to help control inflation.

As of October 13, the date of this writing, federal funds futures were pricing in the equivalent of approximately three additional 25-bps increases by mid-2027.D Rather than debating how quickly the Fed might continue cutting toward neutral, investors are now considering whether the September increase was only the first step in a renewed series of hikes.

The move in the 2-year Treasury captures that shift as well as anything. The yield began 2026 at approximately 3.47% and reached 4.80% in October, an increase more than 130 bps year-to-date. This was roughly 140 bps above its February low of 3.38%.D That is a meaningful reversal for a portion of the curve closely tied to the expected path of monetary policy. The market's message is no longer simply that rates may remain higher for longer. Increasingly, it's that rates may need to move higher still.

All about the data

So, what has been the key catalyst for the change in policy direction? At the very core, it has been the data. Inflation has remained persistent enough to limit the Fed's flexibility, while economic growth and labor market conditions have held up better than many expected. The combination has challenged the assumption that simply cutting rates toward neutral would be enough. Inflation doesn't necessarily need to reaccelerate sharply for this dynamic to continue. If progress toward the Fed's 2.0% objective remains slow or uneven, policymakers may have little reason to provide rate relief. And if inflationary pressures intensify, the case for additional tightening becomes more difficult to ignore.

At the same time, the economy has continued to absorb higher rates without showing the degree of deterioration many had anticipated. The labor market has remained resilient and continues to add new jobs, even if sometimes less than expected in the monthly data releases. Consumer activity has held up relatively well, and continued economic growth has provided policymakers with room to remain patient. However, this last point about resilient economic strength may also be a sign that the current policy rate is not as restrictive as previously believed or needed.

All this leads to a broader question: What if a neutral policy stance is simply higher than we've grown acclimated to? For much of the period following the global financial crisis and then reinforced by the pandemic, investors became accustomed to unusually low interest rates. But changes in inflation dynamics, fiscal policy, investment and the general structure of the economy are suggesting that the policy rate that neither stimulates nor restricts growth is now higher than it was during the last cycle. That would challenge the assumption that interest rates will naturally return to the levels that prevailed in the years before inflation reemerged. It could also help explain why the market is pricing in a higher path for policy after the Fed had already begun cutting. The market's repricing also suggests that hopes for materially lower borrowing costs may take longer to be realized.

As of October 13, federal funds futures were implying an overnight rate of approximately 4.15% by December 2026. This rises to 4.43% by March 2027 and again to 4.66% by July 2027.D That's forecasting quite a shift higher during the first half of next year. Compared with the current implied overnight rate of approximately 3.88%, the futures curve was pricing the equivalent of about three additional 25-bps increases by mid-2027. Of course, futures pricing is not a promise that the Fed will follow that exact path. Expectations can and do change quickly, and we will have plenty of inflation, employment and growth data to mull over. Still, the shift is significant. The market has moved beyond simply removing anticipated cuts and is now assigning meaningful weight to the idea that further tightening may be necessary.

The silver lining?

Importantly, the Fed does not have to deliver every increase currently reflected in futures for short-term Treasury yields to remain elevated. Financial markets continually incorporate new information into prices and expectations, and the front end of the curve reflects the expected path of policy across multiple meetings, not simply the outcome of the next one. If the market pushes easing further into the future, raises its estimate of the peak policy rate, or concludes that the eventual policy floor will be higher, 1- to 3-year Treasury yields could remain under upward pressure. Even if the Fed ultimately delivers fewer hikes than the futures curve currently implies, an extended period of restrictive policy may be enough to keep front-end yields elevated. Put it all together and the approximately 130-bps increase in the 2-year Treasury yield reflects a broader reassessment of how high rates may need to go. It also reflects a reassessment of how long rates may remain elevated and where they may ultimately settle. And although the financial media and politicians often focus on the cost side of the equation when it comes to interest rates, for short-duration investors that shift higher is the silver lining.

In terms of portfolio construction, the risk is relatively straightforward. If the Fed tightens further, or if the market raises its expected policy path again, short-term Treasury yields could continue to rise. That would place downward pressure on the market value of existing fixed-income securities and could create additional near-term volatility. The other side of that trade-off is the increasingly attractive carry and current income potential. With the 2-year Treasury at 4.66%, investors are being paid considerably more than the beginning of the year. Higher starting yields provide more income and may offer a larger cushion against modest increases in market rates.

Short-duration maturities also give investors more frequent opportunities to reinvest. That reinvestment flexibility is particularly valuable when the direction of monetary policy remains uncertain. If yields move higher, maturing securities and available cash can be put to work at more attractive levels. If yields remain relatively stable, investors can continue collecting the attractive income currently available. And if inflation eventually moderates and the Fed can ease, short-duration holdings may still benefit from some price appreciation. Expected bouts of volatility aside, it appears to be a favorable environment for fixed income investors focused on the short end of the curve.

Markets

Treasury rates

Sep 2026

Aug 2026

Dec 2025

3-month

4.12%

3.83%

3.63%

6-month

4.33%

3.99%

3.60%

1-year

4.54%

4.15%

3.47%

2-year

4.89%

4.34%

3.47%

3-year

5.00%

4.41%

3.54%

5-year

5.09%

4.50%

3.73%

7-year

5.19%

4.62%

3.94%

10-year

5.29%

4.75%

4.17%

Total returns

Sep 2026

Q3 2026

YTD 2026

ICE BofA 3-Month Treasury Bill Index

0.27%

0.89%

2.37%

ICE BofA 6-Month Treasury Bill Index

0.21%

0.87%

2.28%

ICE BofA 12-Month Treasury Note Index

0.02%

0.62%

1.82%

S&P 500

-0.35%

2.30%

13.12%

Nasdaq

1.93%

2.61%

13.90%

Source: Bloomberg and SVB Asset Management as of 09/30/2026.

Agency and corporate yields

Agency

AA Ind

A- Ind

AA Fin

A- Fin

3-month

4.18

4.16

4.23

4.21

4.33

6-month

4.30

4.29

4.36

4.34

4.46

1-year

4.66

4.66

4.76

4.73

4.86

2-year

4.94

4.99

5.12

5.09

5.29

3-year

5.05

5.14

5.30

5.28

5.48

5-year

5.14

5.27

5.46

5.44

5.64

Source: Bloomberg, Tradeweb and SVB Asset Management as of 09/30/2026.

Sep 2026

GDP*

2.2% (QoQ)†

Unemployment rate

4.2%

CPI**

3.7%

Core PCE***

3.0%‡

Nonfarm payrolls

29,000

Source: Bloomberg and SVB Asset Management as of 10/14/2026. US Bureau of Economic Analysis and US Bureau of Labor Statistics. *Current GDP release as of 09/30/2026. †Quarter over quarter. **Consumer Price Index. ***Personal consumption expenditures. ‡Current PCE release as of 09/30/2026.

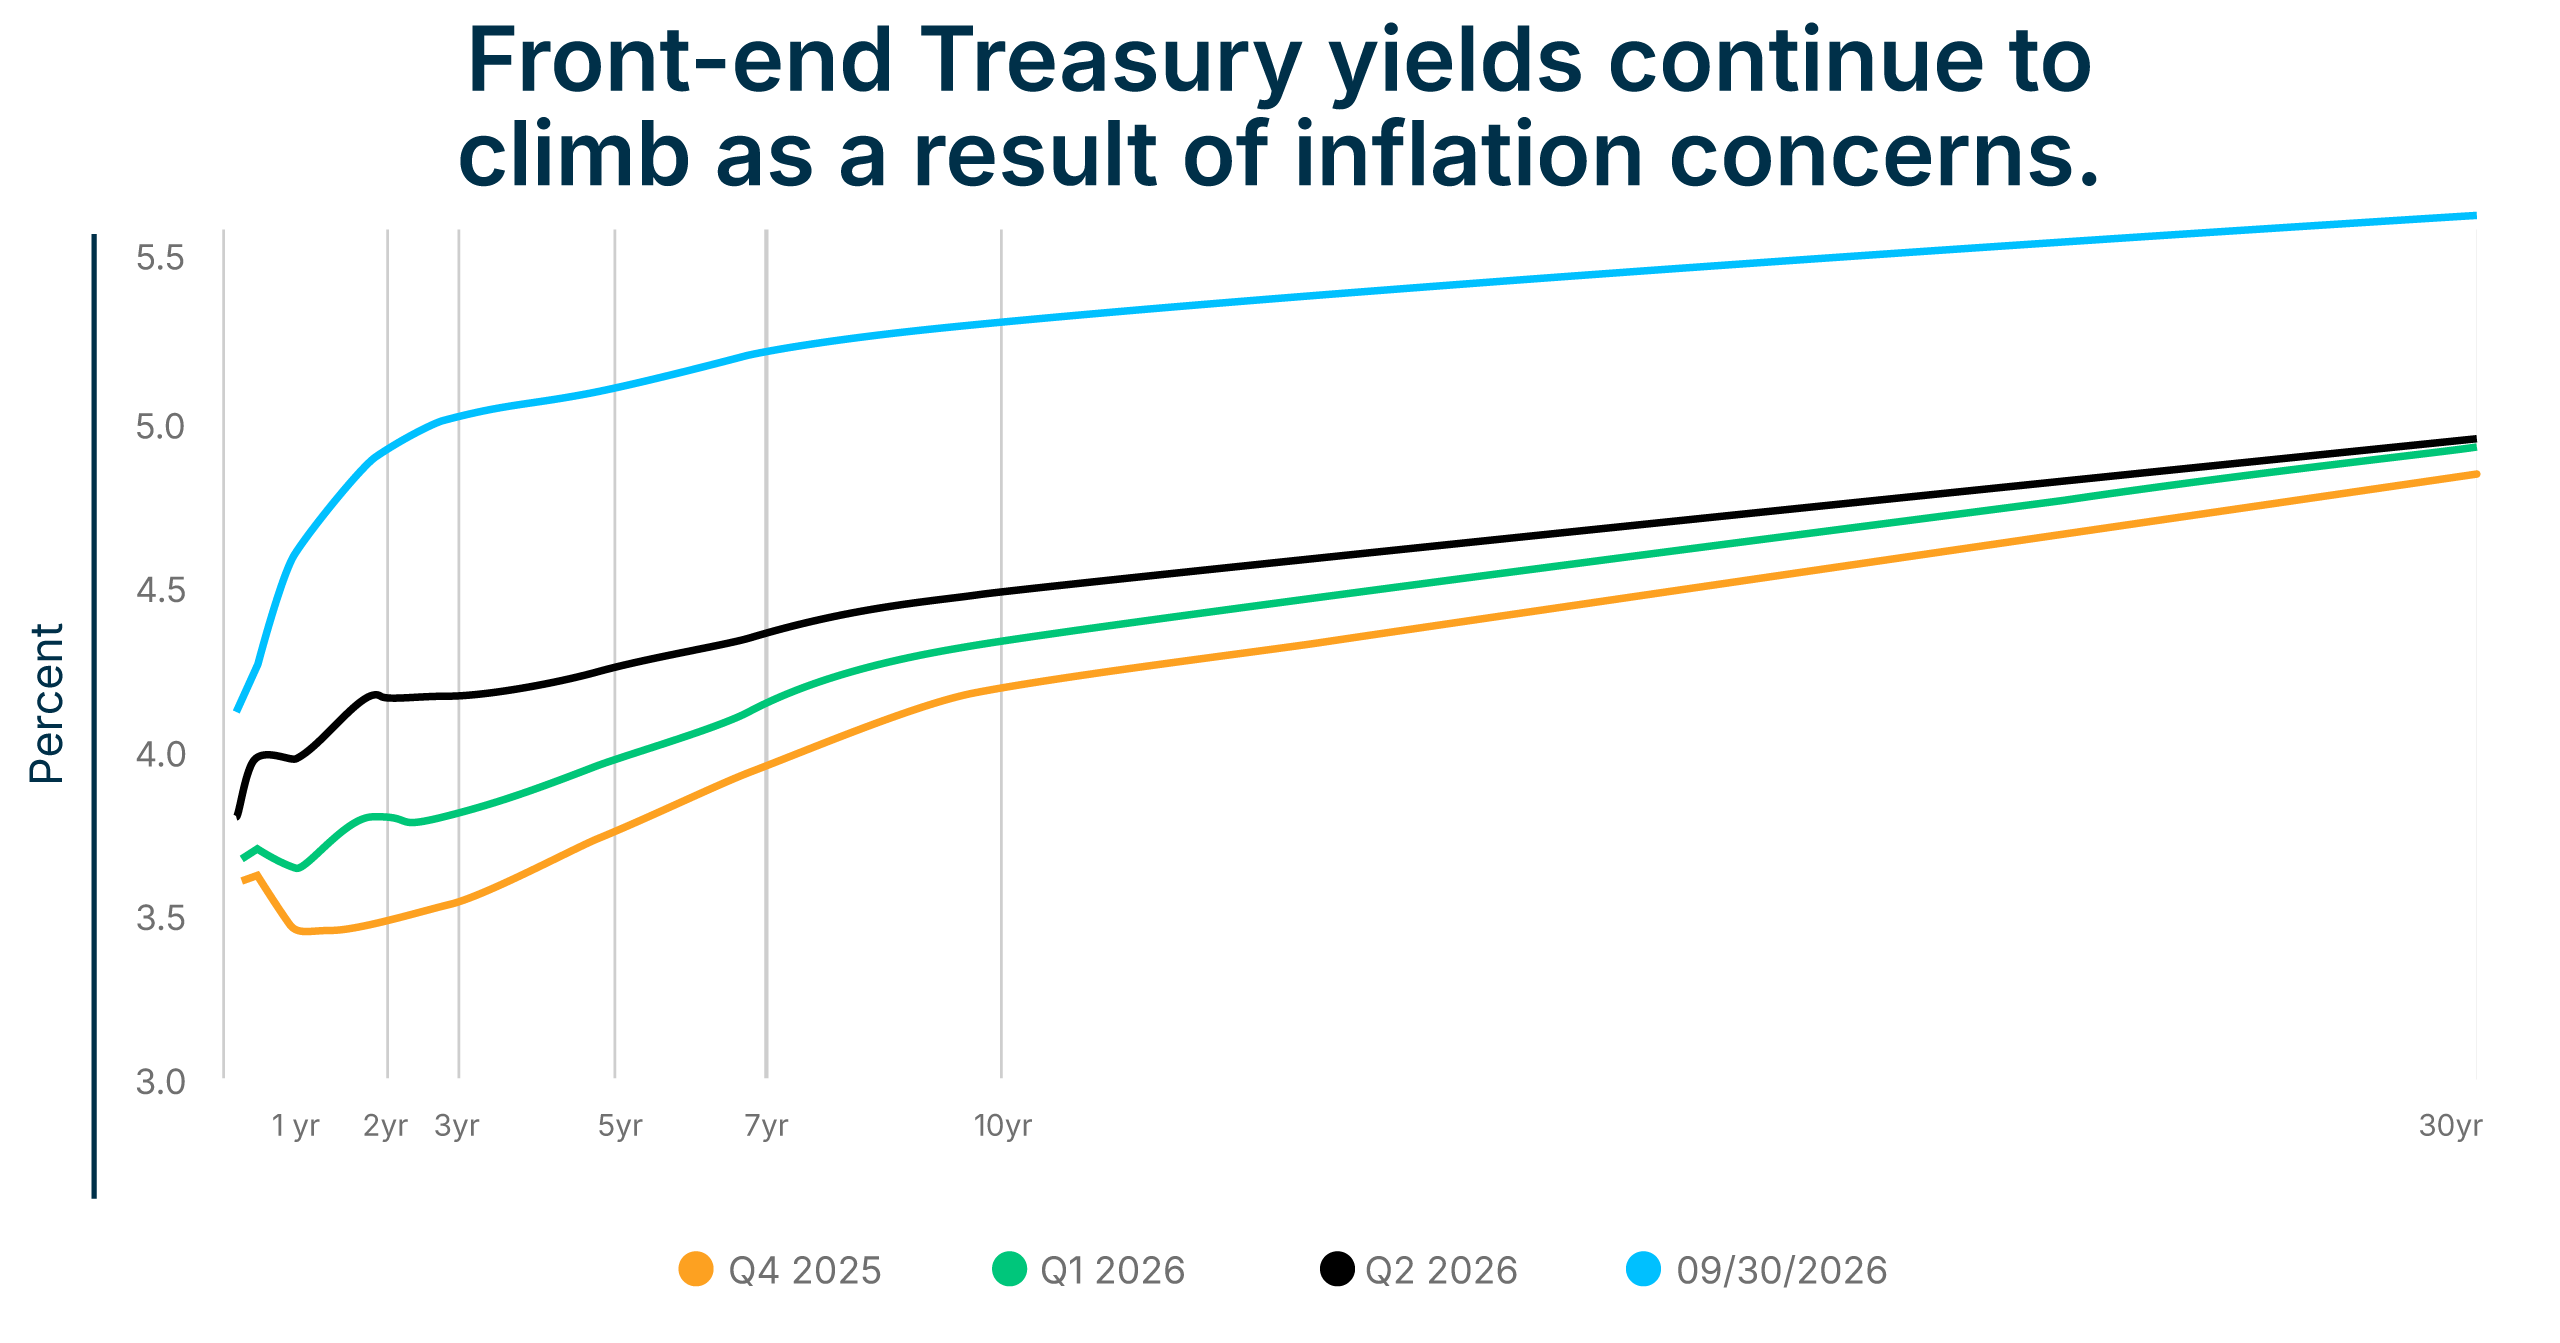
The US treasury yield curve as of September 30, 2026 compared to Q2 2026, Q1 2026 and Q4 2025 depicting elevated front-end yields. Source: Bloomberg, Tradeweb and SVB Asset Management as of 09/30/2026.

Read next

Explore these related articles to help you stay on top of the latest data, insights and developments in US Treasuries and market insights.

Treasury market infrastructure: How it shapes corporate cash investing US Treasuries
Read Article Article

Treasury market infrastructure: How it shapes corporate cash investing

Oct 28, 2026

Jose Sevilla, Jason Graveley

Using a Standby Letter of Credit for a commercial lease to support real estate expansion Global Trade Finance
Read Article Article

Using a Standby Letter of Credit for a commercial lease to support real estate expansion

Oct 26, 2026

Justine Nguyen, Dennis Brown

Startup expense management: Moving from manual processes to scalable controls Spend Management
Read Article Article

Startup expense management: Moving from manual processes to scalable controls

Oct 23, 2026

Angela Sellers

More about the authors

Jose Sevilla

Jose Sevilla

Senior Portfolio Manager

Jason Graveley

Jason Graveley

Senior Manager, Fixed Income Trading


Source: Bloomberg. Data as of October 2, 2026.

Source: Bloomberg, data as of October 13, 2026.

This material, including without limitation to the statistical information herein, is provided for informational purposes only. The material is based in part on information from third-party sources that we believe to be reliable, but which has not been independently verified by us, and, as such, we do not represent the information is accurate or complete. The information should not be viewed as tax, accounting, investment, legal or other advice, nor is it to be relied on in making an investment or other decision. You should obtain relevant and specific professional advice before making any investment decision. Nothing relating to the material should be construed as a solicitation, offer or recommendation to acquire or dispose of any investment, or to engage in any other transaction.

Indices are unmanaged and cannot be invested in directly. Past performance is not a guarantee of future results.

None of this material, nor its content, nor any copy of it, may be altered in any way, copied, transmitted or distributed to any other party, without the prior express written permission of SVB Asset Management. SVB Asset Management is an investment adviser registered with the U.S. Securities and Exchange Commission (SEC). Registration with the SEC does not in any way constitute an endorsement by the SEC of an investment adviser’s skill or expertise. Moreover, registration does not imply that a registered adviser has achieved a certain level of skill, competency, sophistication, expertise or training in providing advisory services to its clients. SVB Asset Management is a wholly owned, non-bank subsidiary of First-Citizens Bank & Trust Company. For institutional purposes only.

Investment products and services offered by SVB Asset Management:

Are Not insured by the FDIC or any other federal government agency Are Not deposits of or guaranteed by a Bank May Lose Value

First-Citizens Bank & Trust Company, as well as its divisions, subsidiaries, and affiliates (together, First Citizens), are US financial institutions and provide products and services to non-US clients on a cross-border basis from the United States of America. First Citizens is not licensed or regulated as a bank or any other type of financial institution outside of the United States of America. Please review our International Disclosures for more information.

© 2026 First-Citizens Bank & Trust Company. SVB Asset Management is a wholly owned, non-bank subsidiary of First-Citizens Bank & Trust Company.

#1026-0109AD-103127

Back to top
You are now leaving First Citizens Innovation Banking

You will be directed to a different website or mobile app that has its own terms of use, visitor agreement, security and privacy policies. First Citizens Innovation Banking is not responsible for (and does not provide) any products, services or content at the third party site or app, except for the products and services that carry the First Citizens Innovation Banking name.